Investigate Indicator of Compromise (IoC) - Domain Names (DNS)
Purpose
Domain names (for example example.com) are a common Indicator of Compromise (IoC) during security incidents because attackers often use domains for command-and-control and data exfiltration.
This runbook describes how the Modernisation Platform team can, given a domain name and a time window, determine whether anything running in the platform attempted DNS resolution for that domain.
Audience
- Modernisation Platform engineers: use this document to investigate reports/alerts about potentially compromised activity in the platform, and to produce a clear answer with explicit scope and limitations.
- MoJ Security Operations / Monitoring: use this document to understand what the Modernisation Platform can (and cannot) currently evidence when investigating domain-based IoCs.
Process
Preparation — Confirm what you are searching for
You need:
- Domain (for example
example.com) - Time window (UTC) (start and end)
Decide whether you are searching for:
- the exact name (for example
api.example.com), or - the domain and all subdomains (for example
example.com+ anything ending.example.com)
Querying — CloudWatch Logs Insights (central DNS query logs)
In the core-logging account, open CloudWatch Logs Insights, select the central Route 53 Resolver query log group(s), set the time range, then run one of the queries below.
Query A — Exact match (recommended first)
Replace example.com:
fields @timestamp, vpc_id, srcaddr, query_name, query_type, rcode
| filter query_name = "example.com"
| sort @timestamp desc
| limit 10000
Query B — Apex + subdomains (suffix match)
Replace example.com. This matches example.com and anything ending .example.com:
fields @timestamp, vpc_id, srcaddr, query_name, query_type, rcode
| filter query_name = "example.com" or query_name like /\.example\.com$/
| sort @timestamp desc
| limit 10000
Query C — Summary (use after you have hits)
This gives you a quick view of where the queries came from:
fields @timestamp, vpc_id, srcaddr, query_name, rcode
| filter query_name = "example.com" or query_name like /\.example\.com$/
| stats
    min(@timestamp) as first_seen,
    max(@timestamp) as last_seen,
    count() as events,
    count_distinct(srcaddr) as source_ips
  by vpc_id
| sort last_seen desc
Output — What to write in the ticket
Write one of:
Evidence found: “Observed DNS queries for
<domain>between<start UTC>and<end UTC>in central DNS query logs. VPCs:<vpc_ids>. Source IPs:<srcaddrs>(or count). First/last seen:<first_seen>→<last_seen>.”No supporting evidence found: “No DNS queries for
<domain>observed between<start UTC>and<end UTC>in central DNS query logs (coverage: VPCs that emit DNS query logs; core platformnon_live_dataVPCs are not covered).”
Architecture
High Level Design
Below is the high-level architecture of the process and infrastructure that supports investigating domain name IoCs using centralised DNS query logging. VPCs with DNS query logging enabled publish DNS query events into central CloudWatch Logs in the core-logging account. An investigating engineer queries those central logs using CloudWatch Logs Insights.
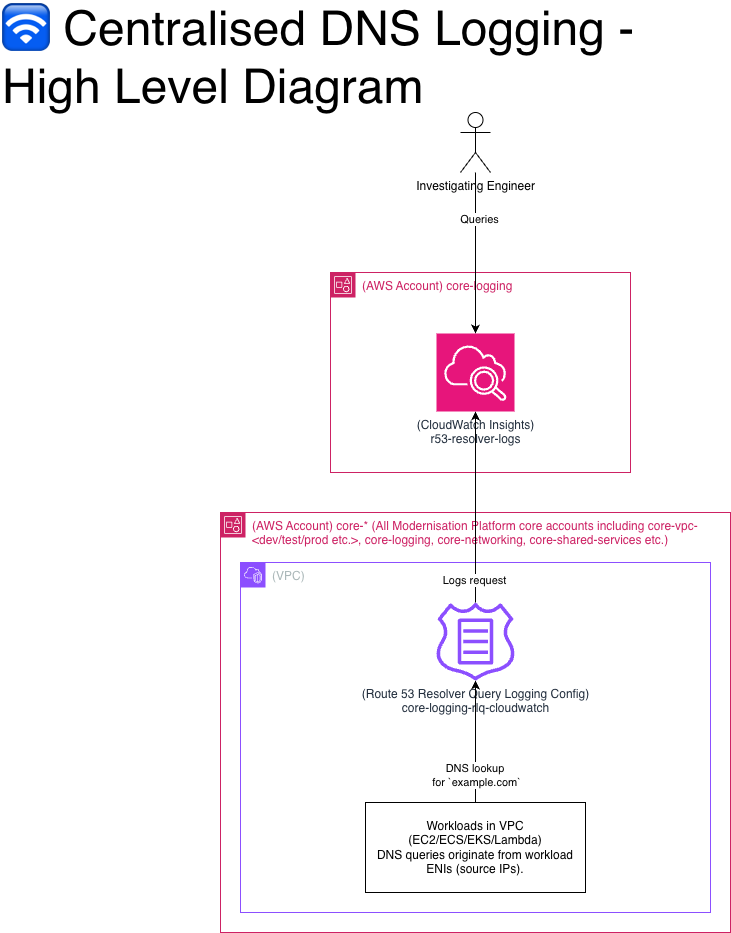 This design provides centralised logging (a single place to search DNS query events) rather than “centralised DNS resolution” (DNS is still resolved within each VPC). In practice, this means DNS visibility depends on whether query logging is enabled for the VPC you care about.
Data Sources (AWS Accounts, VPCs and Route 53 Query Logging)
The data sources for this capability are the VPCs where DNS query logging is enabled. This includes all Member/Business Unit VPCs across the usual environments (development, test, preproduction, production, and sandbox), and core platform VPCs named live_data. Core platform VPCs named non_live_data are not covered.
Data Aggregator (CloudWatch)
CloudWatch Logs in the core-logging account is the central aggregation point for DNS query log events. This is the single place an investigator queries to answer the question: “did anything in the platform attempt to resolve this domain in this time window?”
People - The Investigating Engineer
The investigating engineer is responsible for scoping the question (domain + time window), querying the central CloudWatch logs, and writing down a defensible conclusion with explicit limitations.
FAQ / Examples
If I see DNS queries for the domain, does that mean the domain was contacted?
Not necessarily. It means a workload attempted DNS resolution and may have received IP answers. You still need flow/firewall/proxy logs to prove a connection was made.
If I do not see DNS queries for the domain, does that mean no one contacted it?
No. Common reasons include:
- DNS caching (no query in window)
- Workload used a different DNS resolver (8.8.8.8, DoH, custom)
- Workload used a hardcoded IP (no DNS needed)
- Relevant VPCs do not have Resolver logging enabled
Are there any limitations or known gaps in domain name observability?
non_live_dataVPCs: DNS query logging is not enabled, so we may not be able to provide evidence of DNS lookups originating from these VPCs using this method.- Bypass paths: workloads can avoid appearing in platform DNS query logs by using cached DNS results, an alternative DNS resolver, or hardcoded IP addresses.
- Customer managed VPCs: VPCs that are not managed by the Modernisation Platform will not store their DNS Query Resolver Logs with us and we won’t be able to query them.
What can you/can’t you conclude from querying domain name resolution?
You can conclude:
- A workload did or did not attempt to resolve a domain using platform DNS query logs (where enabled and within covered VPCs).
- When the lookup happened (timestamp).
- Which source client IP initiated the lookup.
- Often, which IPs were returned (A/AAAA), enabling an IP-based follow-on investigation.
You cannot conclude (from DNS query logs alone):
- That the workload successfully established a TCP/TLS/HTTP connection to the domain (DNS lookups are not connection logs).
- Whether traffic was allowed/blocked by firewall rules, NACLs, or Security Groups.
- That “no DNS logs” means “no contact” (DNS caching, alternative resolvers, or hardcoded IPs can bypass this evidence).
Example A — Suspicious domain in a 2-hour window
Domain: bad.example
Window: 2026-03-28T10:00:00Z → 2026-03-28T12:00:00Z
Result (DNS):
- Observed
query_name=bad.example,query_type=A,rcode=NOERROR - Source IPs:
10.x.y.z(map to workload)
- Returned IPs:
203.0.113.10at 10:15Z203.0.113.11at 11:05Z
IPs 203.0.113.10/11 can now be used to query network firewalls, VPC flow logs etc. to evidence if a connection was actually made.