Using Athena
Introduction
Accessing detail from the cloudtrail logs can be a tedious process so these instructions provide basic information on doing this through Athena which uses SQL statements to get the details.
Setting up Athena
On the system we use (core-logging) Athena is set up but the data source will need to be set. The code for the creation located here.
If you need to set up Athena either create a PR as above or follow the instructions provided by AWS here. The version we have in core-logging is called “mod_cloudtrail_logs”.“cloudtrail_logs” not the cloudfront_logs table as suggested in the setup documentation.
On core-logging the table is rebuilt, daily, by a lambda routine that runs at 12:15. Please note this if you intend to undertake any work at this time.
Creating queries in Athena
Setting up queries in Athena follows basic SQL rules and is relatively simple.
Access Athena through the AWS console and select the query editor option. From here you can pick up saved queries or create your own. At the time of writing there are no saved queries.
Under the data options you will not need to change the data source or database. These are set for the correct database and data source. Similarly, under settings and manage you will not need to change the S3 bucket in use.
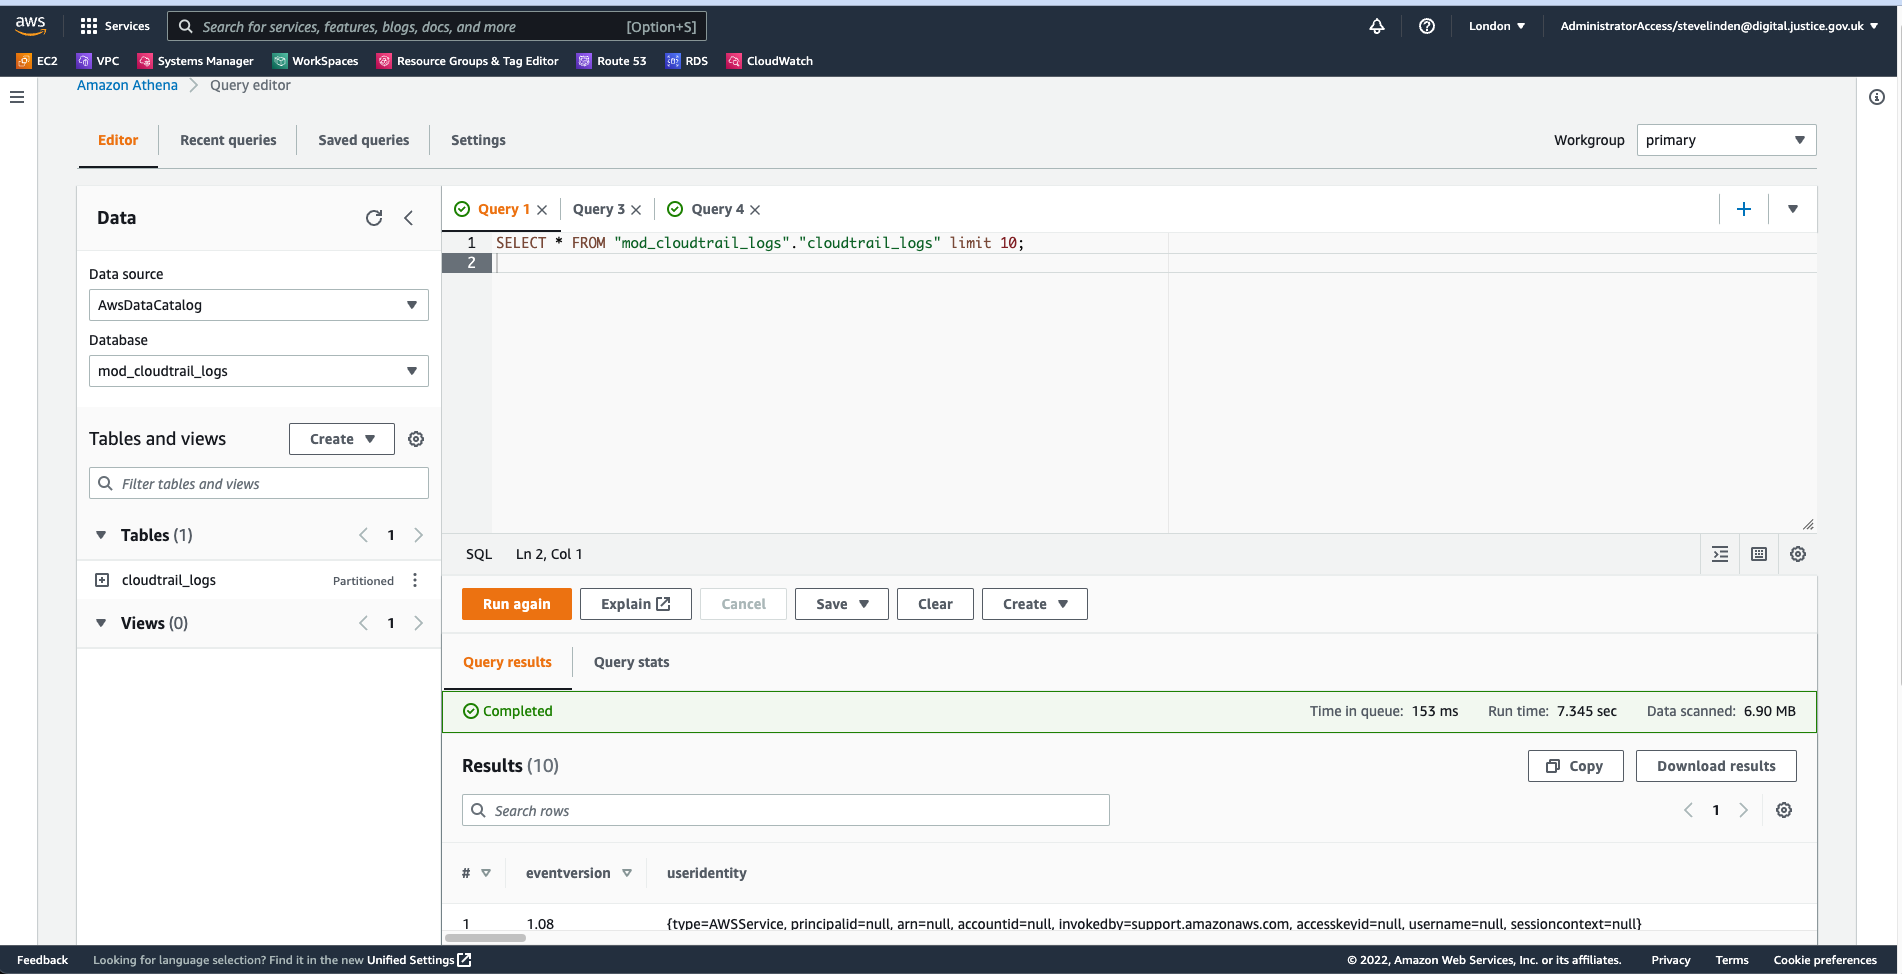
A sample of the data and columns in the table can be found using the following query
SELECT * FROM “mod_cloudtrail_logs”.“cloudtrail_logs” limit 10;
This will list the first 10 rows found. It provides an idea of what is recorded, the accounts used etc.
If you know what columns you want to see (check the above query or look at the table layout) you can select those in the query. Note the SQL is a little picky on having quotes around the statements (see example below) but not always!
Scrolling to the right (on the bottom section) will allow you to see all of the columns selected and sample data.
There is a lot of data in the table so it’s best to avoid ending with the above and selecting specific ranges of data using a WHERE clause. This will reduce the amount of data you see and, also, reduce what you see and the query time.
An example might be, if you want to see all the data from core-vps-production
SELECT * FROM “mod_cloudtrail_logs”.“cloudtrail_logs” where account = ‘278663825216’ order by eventtime desc;
Which produces a lot of results. Due to the width of the results I have not pasted details in here. Suffice to say, wherever possible do NOT select all columns.
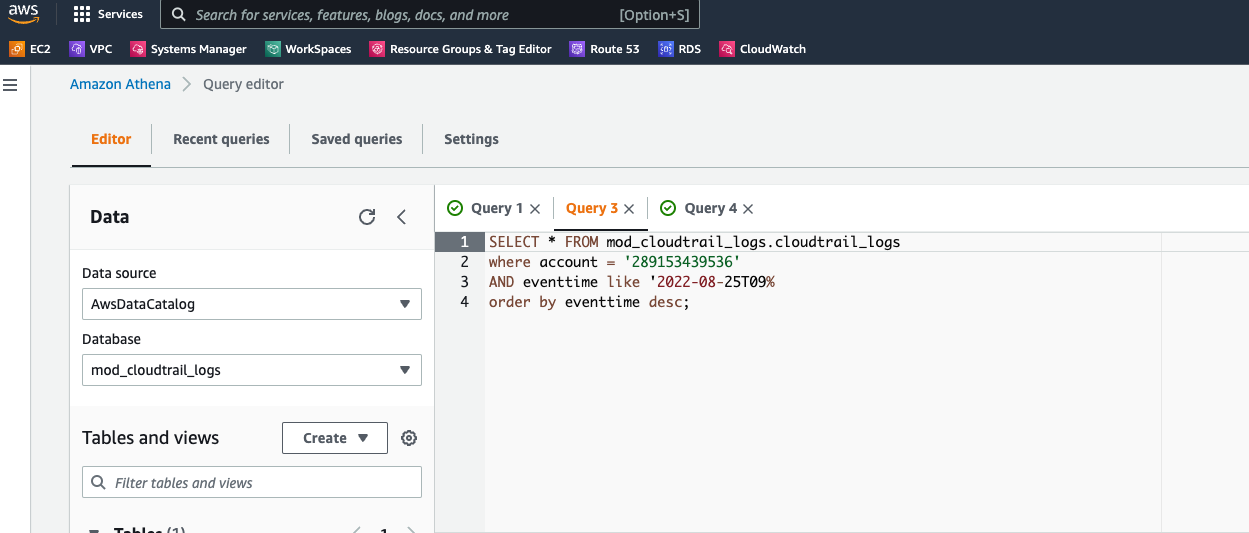
Or another example is
As a note, account and eventtime can both be inside double quotes (“ ”) but this is not required. The double quotes around the database and table name were, initially, needed but could be removed after the query had run successfully.
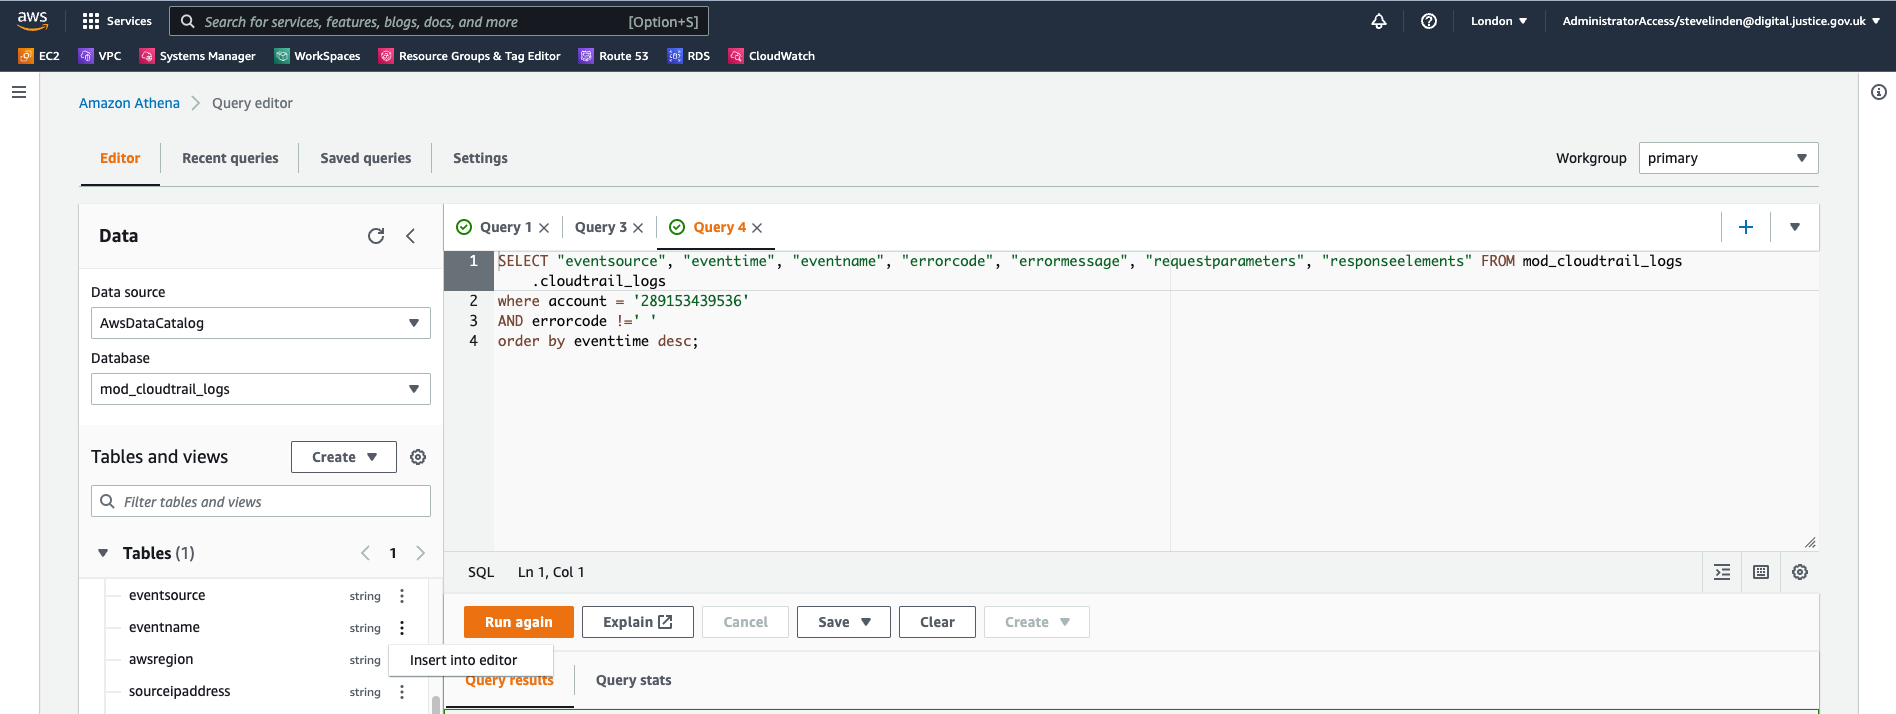
Another example, only selecting some columns (for data-and-insights-wepi-development) when there is an error in place.
SELECT “eventsource”, “eventtime”, “eventname”, “errorcode”, “errormessage”, “requestparameters”, “responseelements” FROM mod_cloudtrail_logs.cloudtrail_logs where account = ‘289153439536’ AND errorcode !=‘ ’ order by eventtime desc;
This will select a lot of data but will help in finding errors. The columns were added from the table list (using the 3 dots next to the field) which automatically puts the quotes around them.


