Cost Metrics
Viewing Platform Metrics in Grafana
Our Grafana dashboard, “athena-cost-and-usage-report,” provides visibility into detailed AWS cost and usage metrics, powered by data from AWS Cost and Usage Reports (CUR) processed by Athena. This document explains where to find the dashboard, what data it displays, and how the underlying setup operates.
Accessing the Dashboard
- Use this link: Athena-Cost-And-Usage-Report
OR - Log into Grafana with your user credentials.
- Navigate to Dashboards from the left sidebar.
- Open the “modernisation-platform” folder
- Select the “athena-cost-and-usage-report” dashboard under the platform metrics section.
Using the account_id Filter
With the new account_id filter, you can view cost metrics specific to individual accounts:
- Account-Specific Metrics: Select an account from the
account_iddropdown at the top of the dashboard to display cost metrics for that account. This allows you to track expenses by environment, providing greater cost transparency across projects.
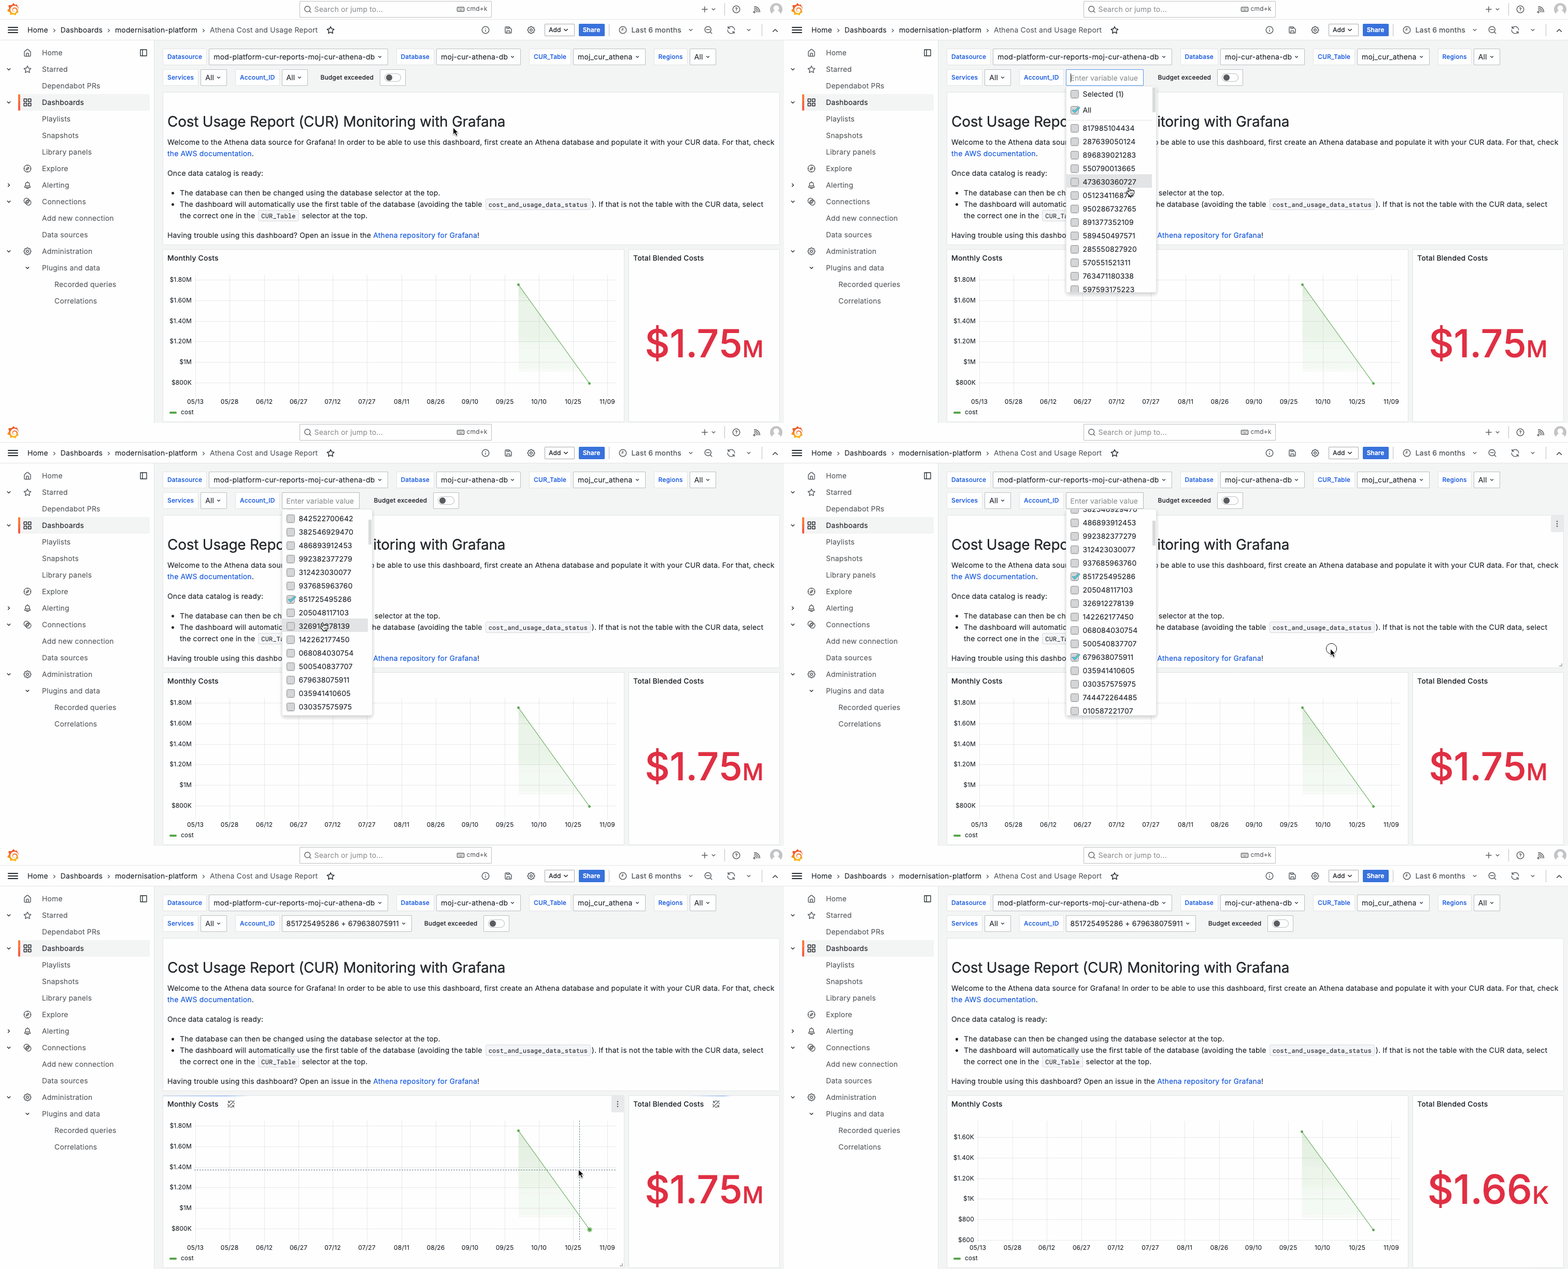
Use the dropdown list to select your account number:

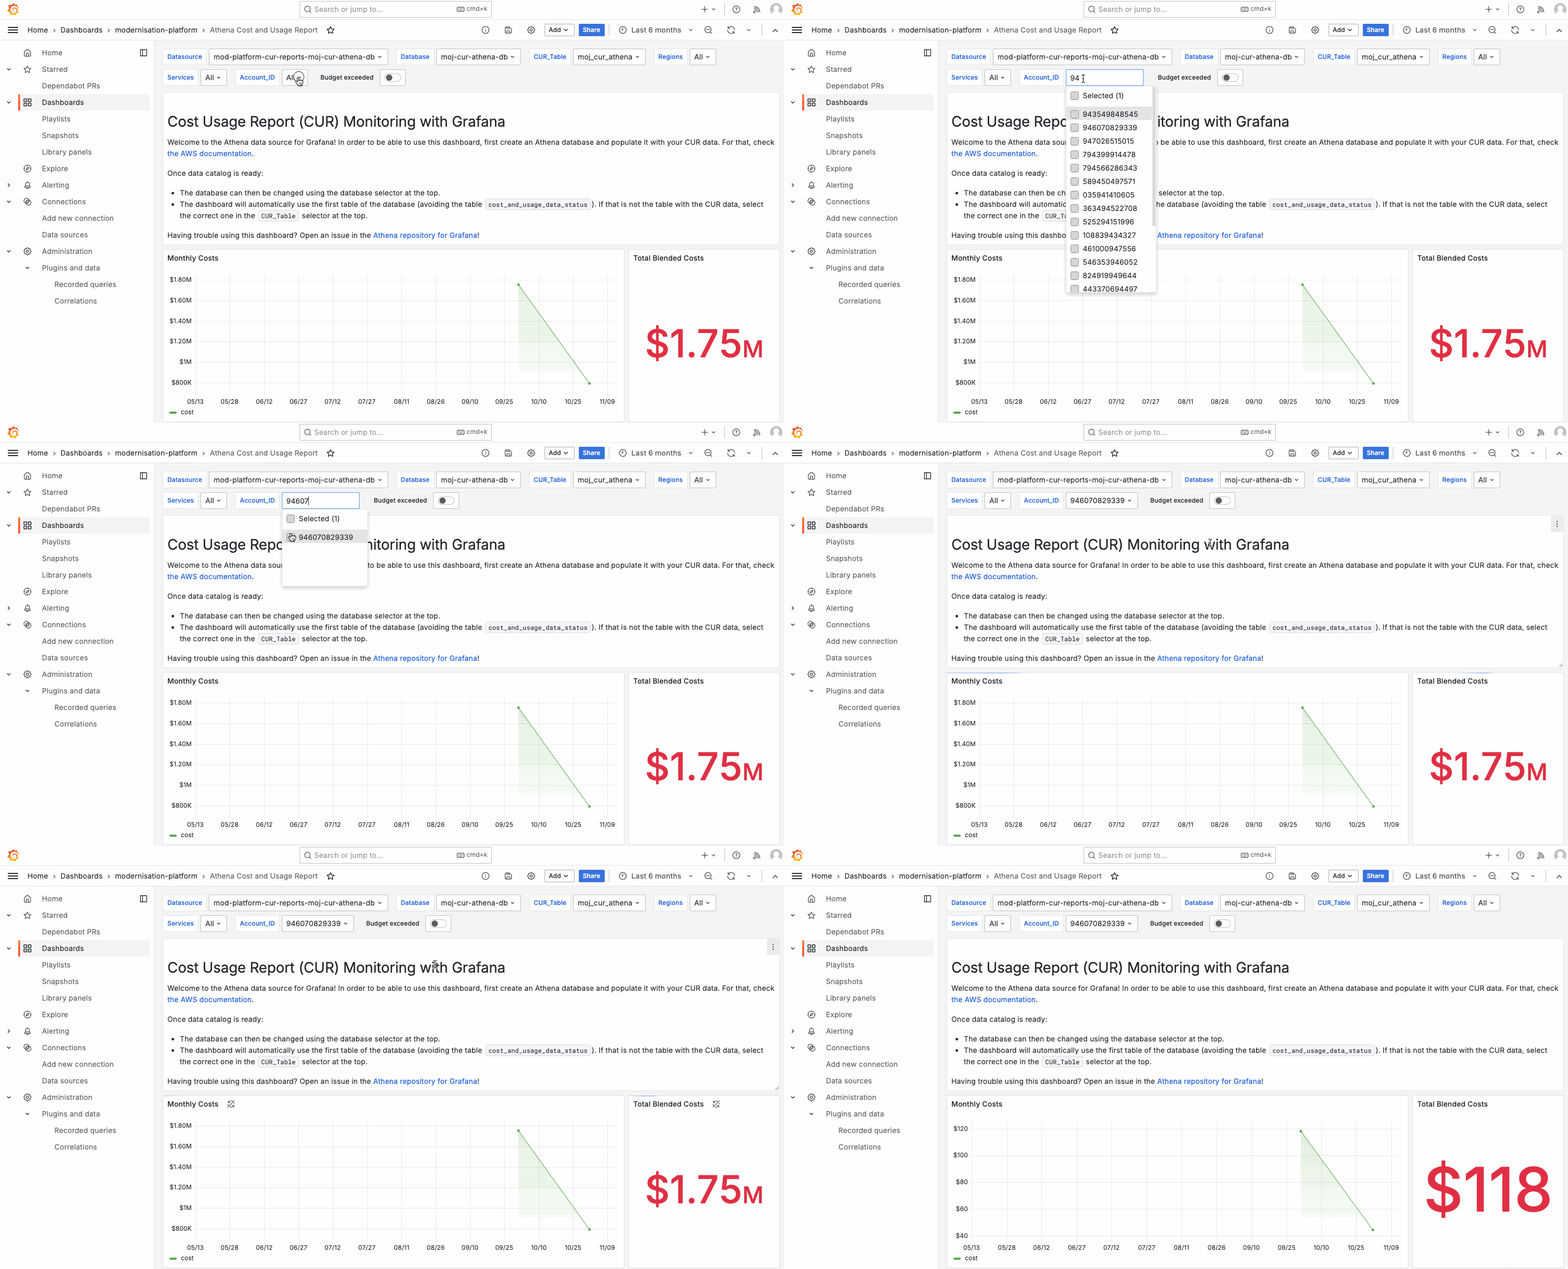
Alternatively, type (or paste) your account number directly into the account_id field:

TIP: If you plan on regularly checking your cost metrics, bookmark the URL after selecting your account_id(s). The bookmark will automatically populate these selections for future use.
Data Flow and Components
The data displayed in this dashboard is updated continuously based on AWS CUR files, which are processed and transformed through a combination of AWS Glue and Lambda services. Here’s a breakdown of the main components that feed into the dashboard:
1. Cost and Usage Report (CUR) Setup
- CUR is generated in the master account and stored in an S3 bucket.
- For security and accessibility, the data is replicated to a secondary bucket in the core-logging account using S3 cross-account replication for Grafana access.
2. Lambda Functions for Automation
- A Lambda function triggers the AWS Glue crawler when new CUR files arrive in the S3 bucket.
- This function ensures the data remains up-to-date, automating updates to the Athena table.
3. AWS Glue Jobs for Data Processing
- AWS Glue crawlers run scheduled jobs, scanning the replicated S3 bucket to catalog new CUR files.
- The crawler’s output is stored as an Athena-compatible schema, enabling efficient querying of the data.
4. Athena Querying
- Athena queries the processed CUR data based on a predefined query structure.
- The output of these queries feeds directly into Grafana, providing near real-time cost and usage metrics on the dashboard.
Key Metrics and Insights
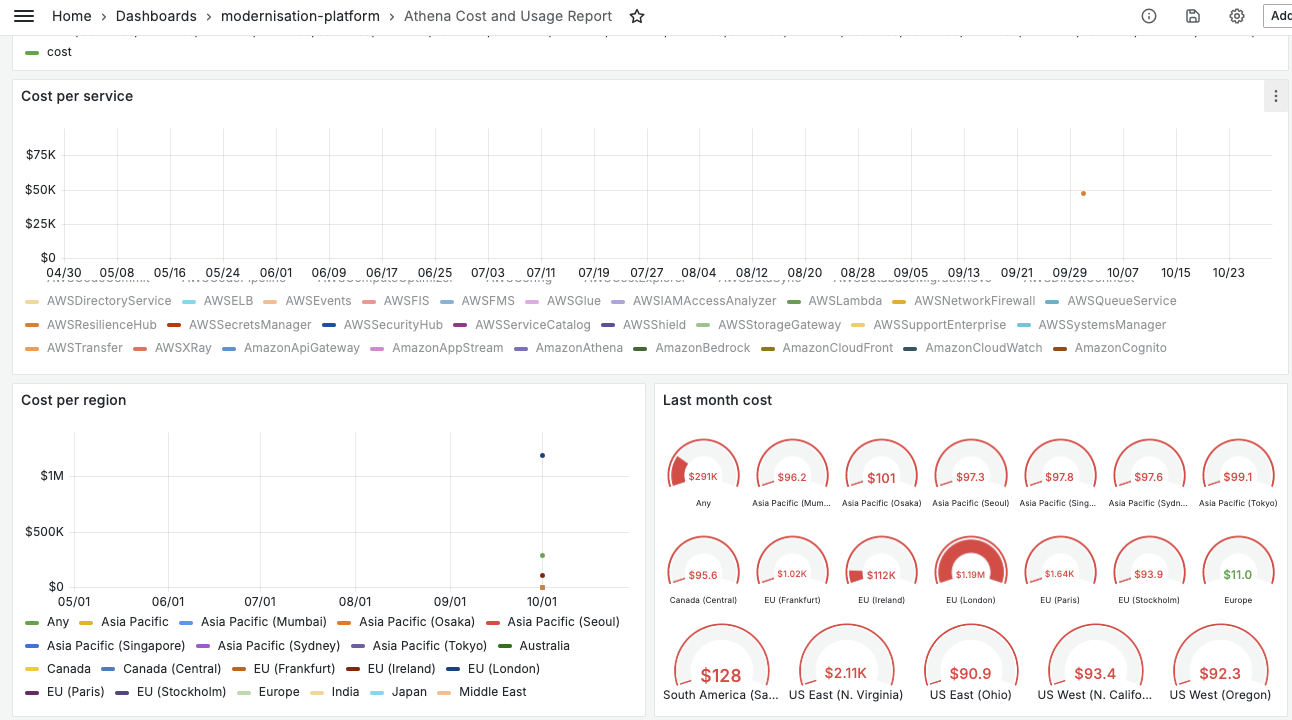
The “athena-cost-and-usage-report” dashboard offers:
- Monthly cost overviews to track AWS usage trends.
- Service-specific costs for a more granular view of spending patterns.
- Account-specific costs using the
account_idfilter, so users can view metrics tailored to selected accounts and environments.
